Inventory Volatility Diagnosis & Demand Planning Realignment
April 2, 2026
About this solution
Problem this solves
Your inventory swings 40–60% month-to-month. Finance says you're overstocked. Operations says you need more safety stock. Neither is wrong, and that's the problem. The real issue lives upstream in demand planning—your data reflects poor signal separation, not actual customer volatility. You're optimizing for noise.
Approach
I start by isolating demand signal from internal noise: promotional timing decisions, batch order patterns, forecast error from previous cycles. This takes 3–4 weeks. Then I map the forecasting communication breakdown—where planning assumptions misaligned with sales reality, where upstream visibility stopped. We rebuild the demand baseline your inventory decisions should actually use. Only after signal is clean do we touch safety stock formulas or reorder points. Tools include demand pattern decomposition, forecast accuracy trending (MAPE/bias split), and safety stock recalibration against the real volatility you'll actually face.

Insight
Most companies calculate safety stock from historical standard deviation—which includes all their past forecasting mistakes baked in. You're setting buffer against noise, not volatility. The CFO who says 'we're carrying too much inventory' and the planner who says 'we need bigger buffers' are both reading the same corrupted data. Until you separate what's demand from what's your own bad forecast, you'll chase inventory costs in circles. I've watched companies drop safety stock by 15–22% just by fixing how they baseline volatility, with zero stockout increase.
In practice
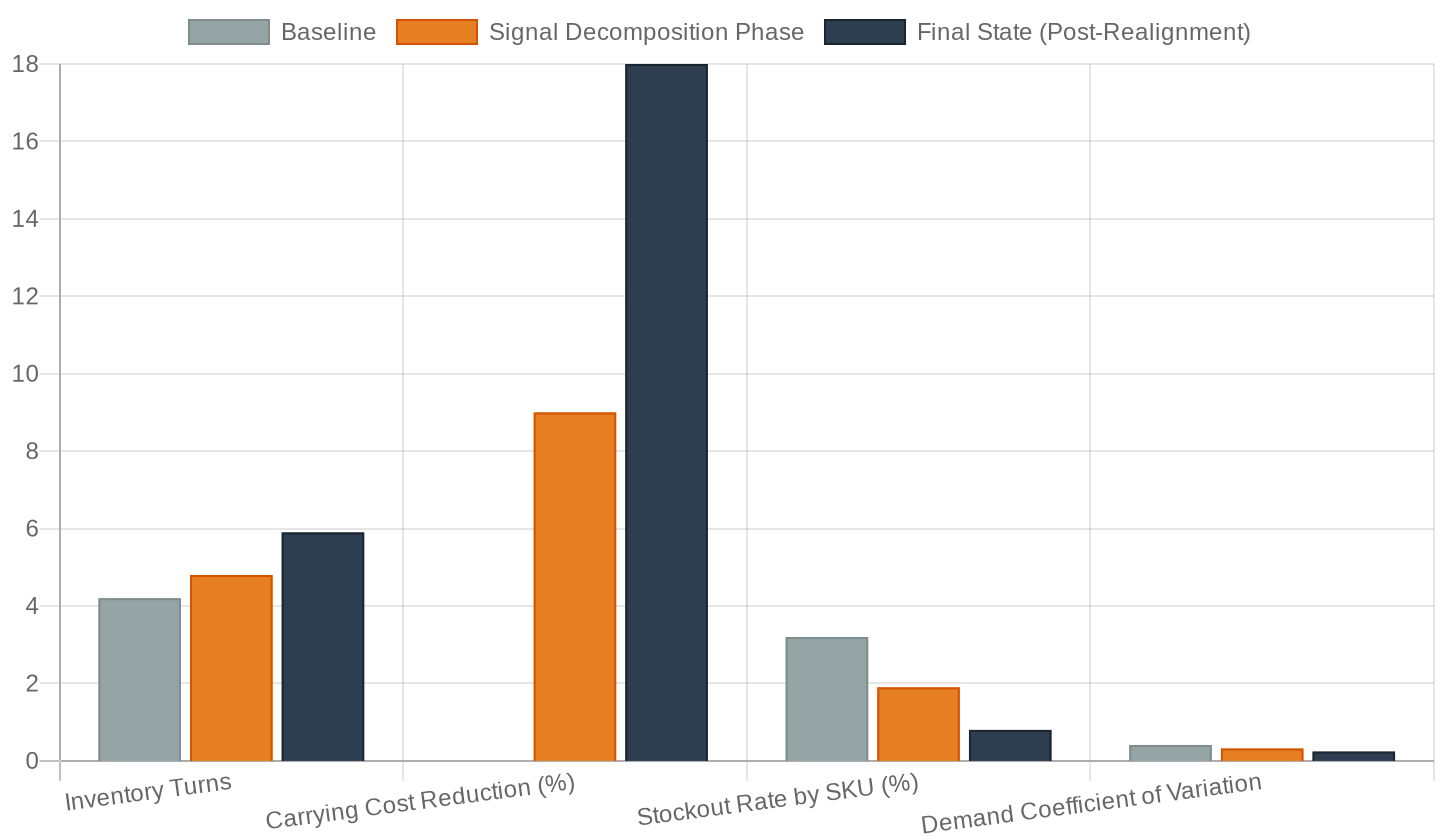
Mid-sized automotive parts supplier, ~280 people. Inventory turns were 4.2x annually—industry median is 6.8x for their segment. They claimed demand was 'too volatile.' Initial audit showed their 12-month demand CV (coefficient of variation) at 0.41. Looked random. Dug into forecast history: their demand planners were using a 6-month rolling average with zero adjustment for known seasonal ramps tied to OEM production cycles. Actual demand without internal forecast lag had CV of 0.24. We rebuilt their baseline demand input, adjusted safety stock formulas from 2.8 weeks to 1.9 weeks of buffer, and trained the team on signal/noise separation. Within 6 months, turns improved to 5.9x, carrying costs dropped 18%, and stockouts declined from 3.2% to 0.8% of SKUs. The volatility didn't change. Their visibility did.
Scope and fit
Best fit: 50–500 person manufacturers with 300+ SKUs, demand variability they can't explain, and a forecasting process that hasn't been audited in 3+ years. Typically the Operations Director or Supply Chain Manager who owns the P&L impact of excess inventory and stockouts. Out of scope: pure logistics optimization, warehouse automation, or vendor consolidation. Also won't solve for structural demand shifts (if your market is actually shrinking). This works when the volatility is real but your visibility is poor.
Expertise
11 years in operations: 8 years leading inventory and demand planning at two mid-sized manufacturers (automotive parts and electronics), handling demand swings of 35–55% seasonally. 3 years as independent consultant focused on 50–500 person manufacturers—18–22 engagements, majority in demand planning diagnostics and safety stock recalibration. Deep in Excel-based demand analysis, forecast accuracy metrics (MAPE, bias, tracking signal), safety stock methodologies (Normal distribution, service-level based), and the specific communication failures between sales, planning, and operations that create phantom volatility.
Contact
Loading…